
Hotel Dashboard
Utilizing SQL and PowerBi, I was able to create a dashboard. This dashboard allows hotel execs to track their revenue over time, giving them a total. It goes over Average Daily Rates, Total Nights, Average Discount, and even the amount of Car Parking Spaces. This dashboard is even interactive, I was able to employ a slicer which filters by date, and drop down menus to filter by hotel and country.
SQL Queries
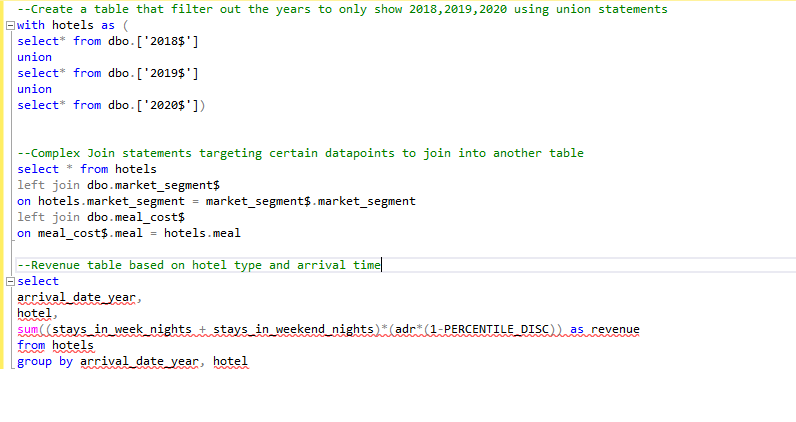
Utilizing union statements, I was able to create a table based off of data that took place in 2018 -2020. From that table I created a separate table using join statements, targeting the meal costs and market type to match and combine the data. Finally there is a command that creates a revenue table that is calculated by the sum of total stays times the average daily rate multiplied by one minus the discount percentage.
Data Visualization with PowerBi

After importing the tables into PowerBi, I was able to create a dashboard for analytical use.